Will India's green hydrogen market leverage SIGHT 2.0 incentives, multi‑segment industrial offtake, and gigawatt‑scale electrolyzer mandates to unlock explosive growth by 2035 or will LCOH gaps, RFNBO certification barriers, and offtake immaturity cap its commercial scalability before reaching the critical sub‑USD 2.50/kg threshold?
Why is a comprehensive assessment of India's green hydrogen market dynamics essential for unlocking a ₹2,62,500 crore (USD 31.5 billion) investment opportunity by 2035, addressing LCOH competitiveness, multi‑segment offtake trends, electrolyzer manufacturing scale‑up, and shaping India's strategic positioning against leading global hydrogen economies like Japan, Germany & Australia?
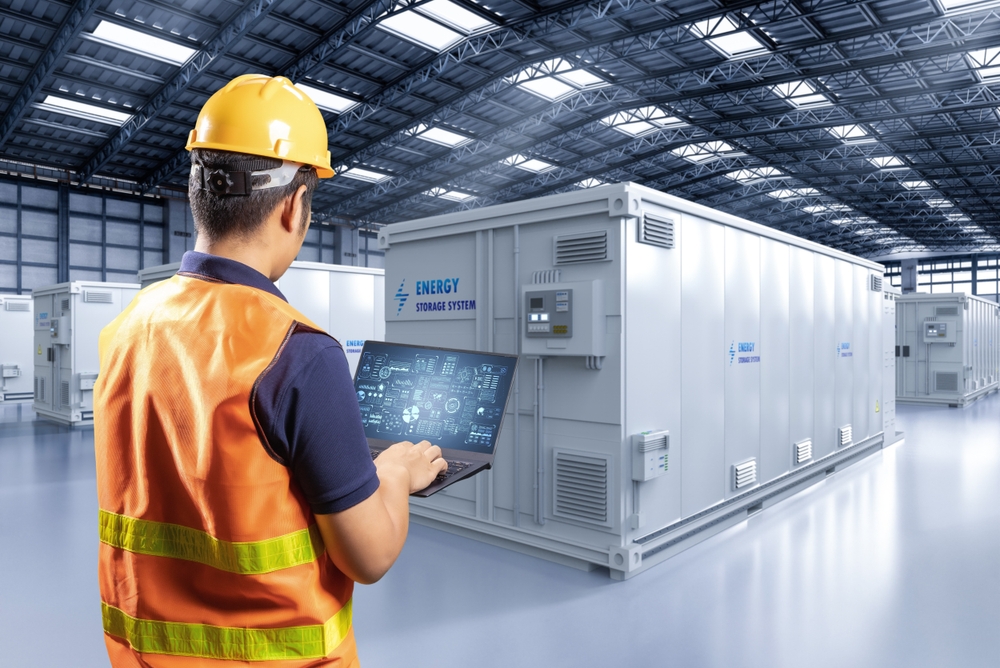
Executive Summary – The Green Molecule Frontier
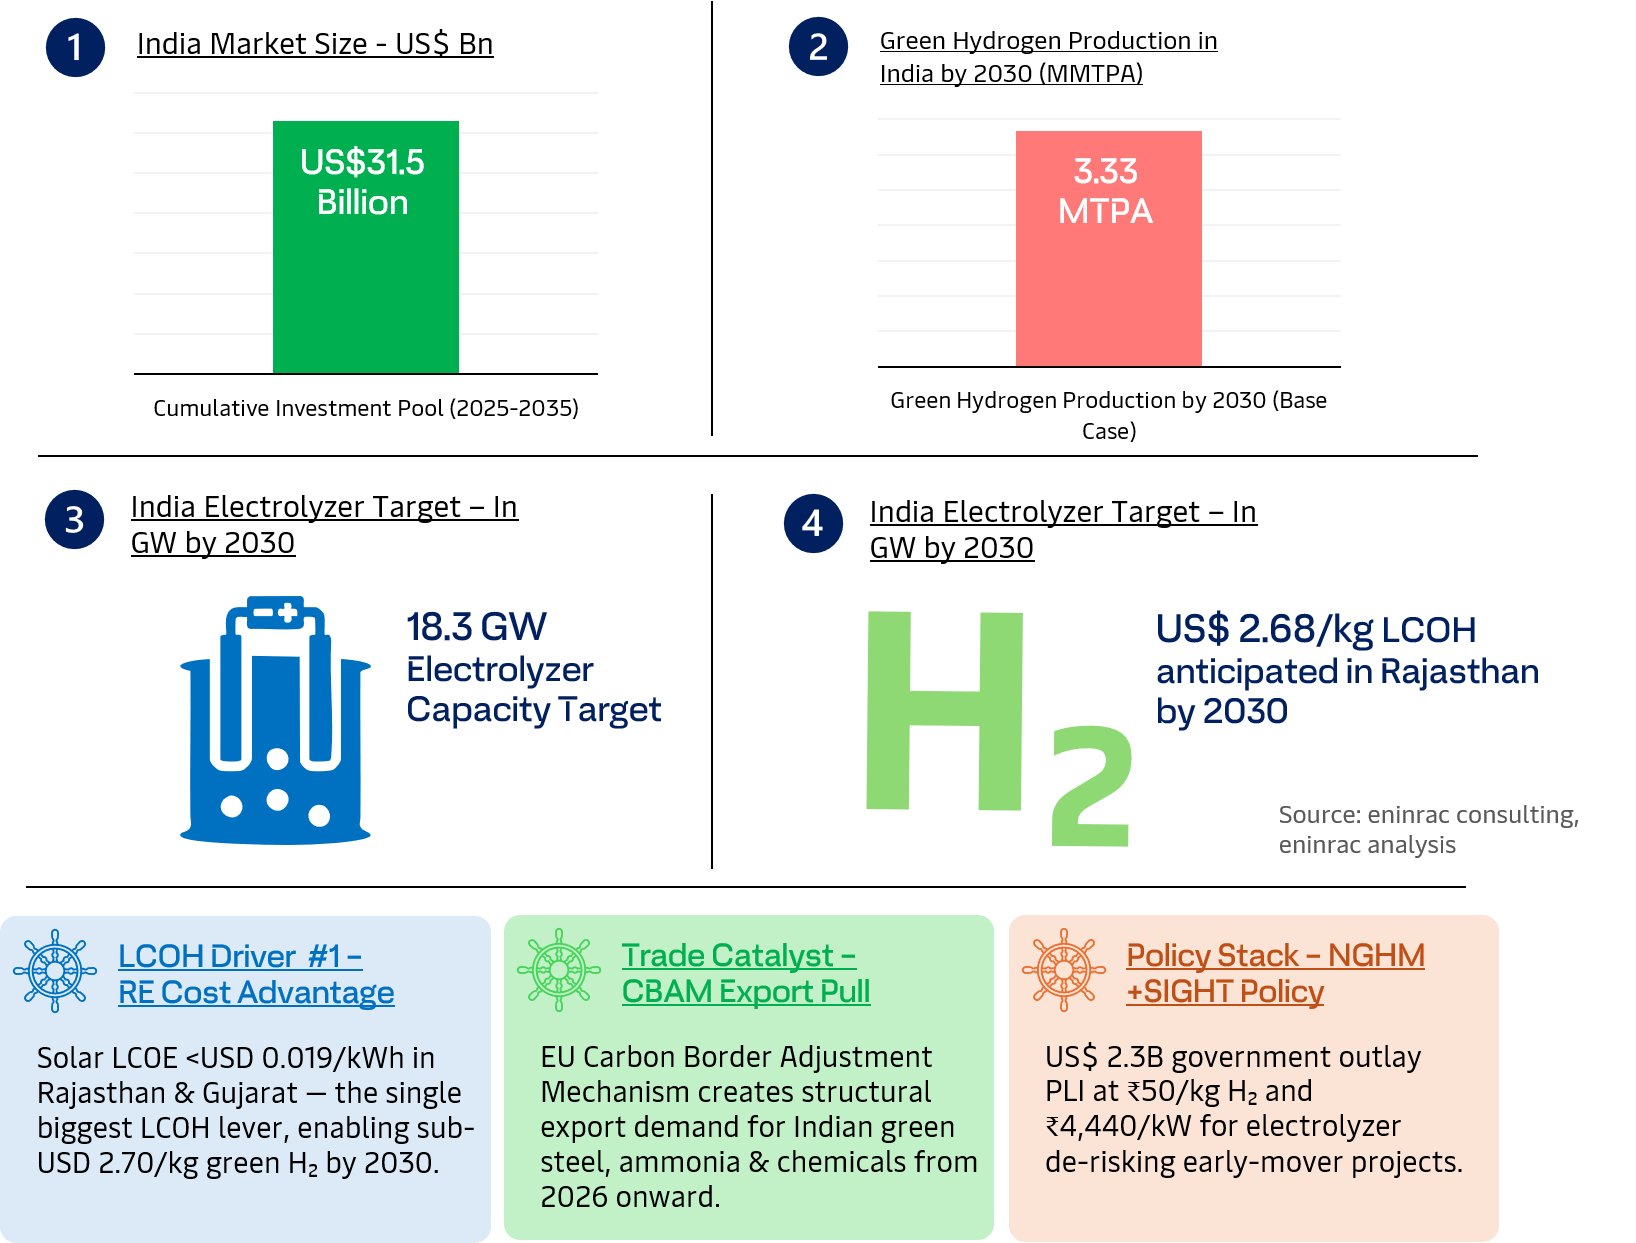
India's green hydrogen sector is poised for transformational growth, with a cumulative investment pool of US$ 31.5 billion mobilized across electrolyzer deployment, dedicated renewable energy infrastructure, ammonia synthesis, and port logistics between 2025 and 2030, positioning India among the most capital‑intensive clean energy markets globally.
On the production frontier, India is projected to achieve 3.33 MTPA of green hydrogen output by 2030 under the base case scenario, driven by SECI Phase I and II tender awards, industrial mandate‑backed offtake in refining and fertilizers, and accelerating export demand from EU and Japan underpinned by an 18.3 GW electrolyzer capacity build‑out that represents one of the largest single‑decade electrolysis deployment programmes in the world. At the economics level, Rajasthan India's most competitive green hydrogen production hub is forecast to achieve a landmark US$ 2.68/kg levelized cost of hydrogen (LCOH) by 2030, powered by sub‑US$ 0.019/kWh solar tariffs and co‑located wind assets, bringing India within striking distance of grey hydrogen parity and firmly establishing its credentials as a globally cost‑competitive green molecule supplier for the decade ahead.
Why India & Why Now : Four Macro Forces
Source: eninrac consulting, eninrac analysis
India Green Hydrogen 2030: Production Capacity, End‑Use Segments & Three‑Scenario Electrolyzer Outlook
India's green hydrogen production capacity is projected to scale exponentially from a nascent 0.14 MTPA in 2025 to 3.33 MTPA by 2030 under the base case scenario and as high as 5.39 MTPA under the accelerated scenario driven by surging export demand for green ammonia, industrial mandate‑backed domestic offtake, and a policy‑accelerated electrolyzer deployment programme targeting 18.3 GW by 2030.
Export‑oriented green ammonia and hydrogen carriers emerge as the dominant demand segment, accounting for 1.85 MTPA under the base case and 2.90 MTPA under the accelerated scenario by 2030, underpinned by long‑term off‑take agreements with EU and Japanese buyers and India's unmatched renewable energy cost advantage.
Domestic refining and chemicals (0.52 MTPA), fertilizer and ammonia (0.38 MTPA), and green steel via DRI‑EAF route (0.28 MTPA) constitute the next tier of high‑conviction demand anchors, supported by PPAC mandates and PLI‑backed industrial substitution.
Emerging segments including green hydrogen mobility FCEVs and bus corridors (0.18 MTPA) and power blending (0.12 MTPA) signal long‑term market diversification, while the delayed scenario (1.44 MTPA, 7.9 GW) quantifies downside risk from offtake immaturity, RFNBO certification delays, and slower‑than‑expected electrolyzer cost reduction providing investors and policymakers with a robust three‑scenario decision framework for capital deployment and policy calibration through 2030.
India Green Hydrogen Market Sizing 2025–2030: Production Scenarios, Segment Demand & Electrolyzer GW Outlook
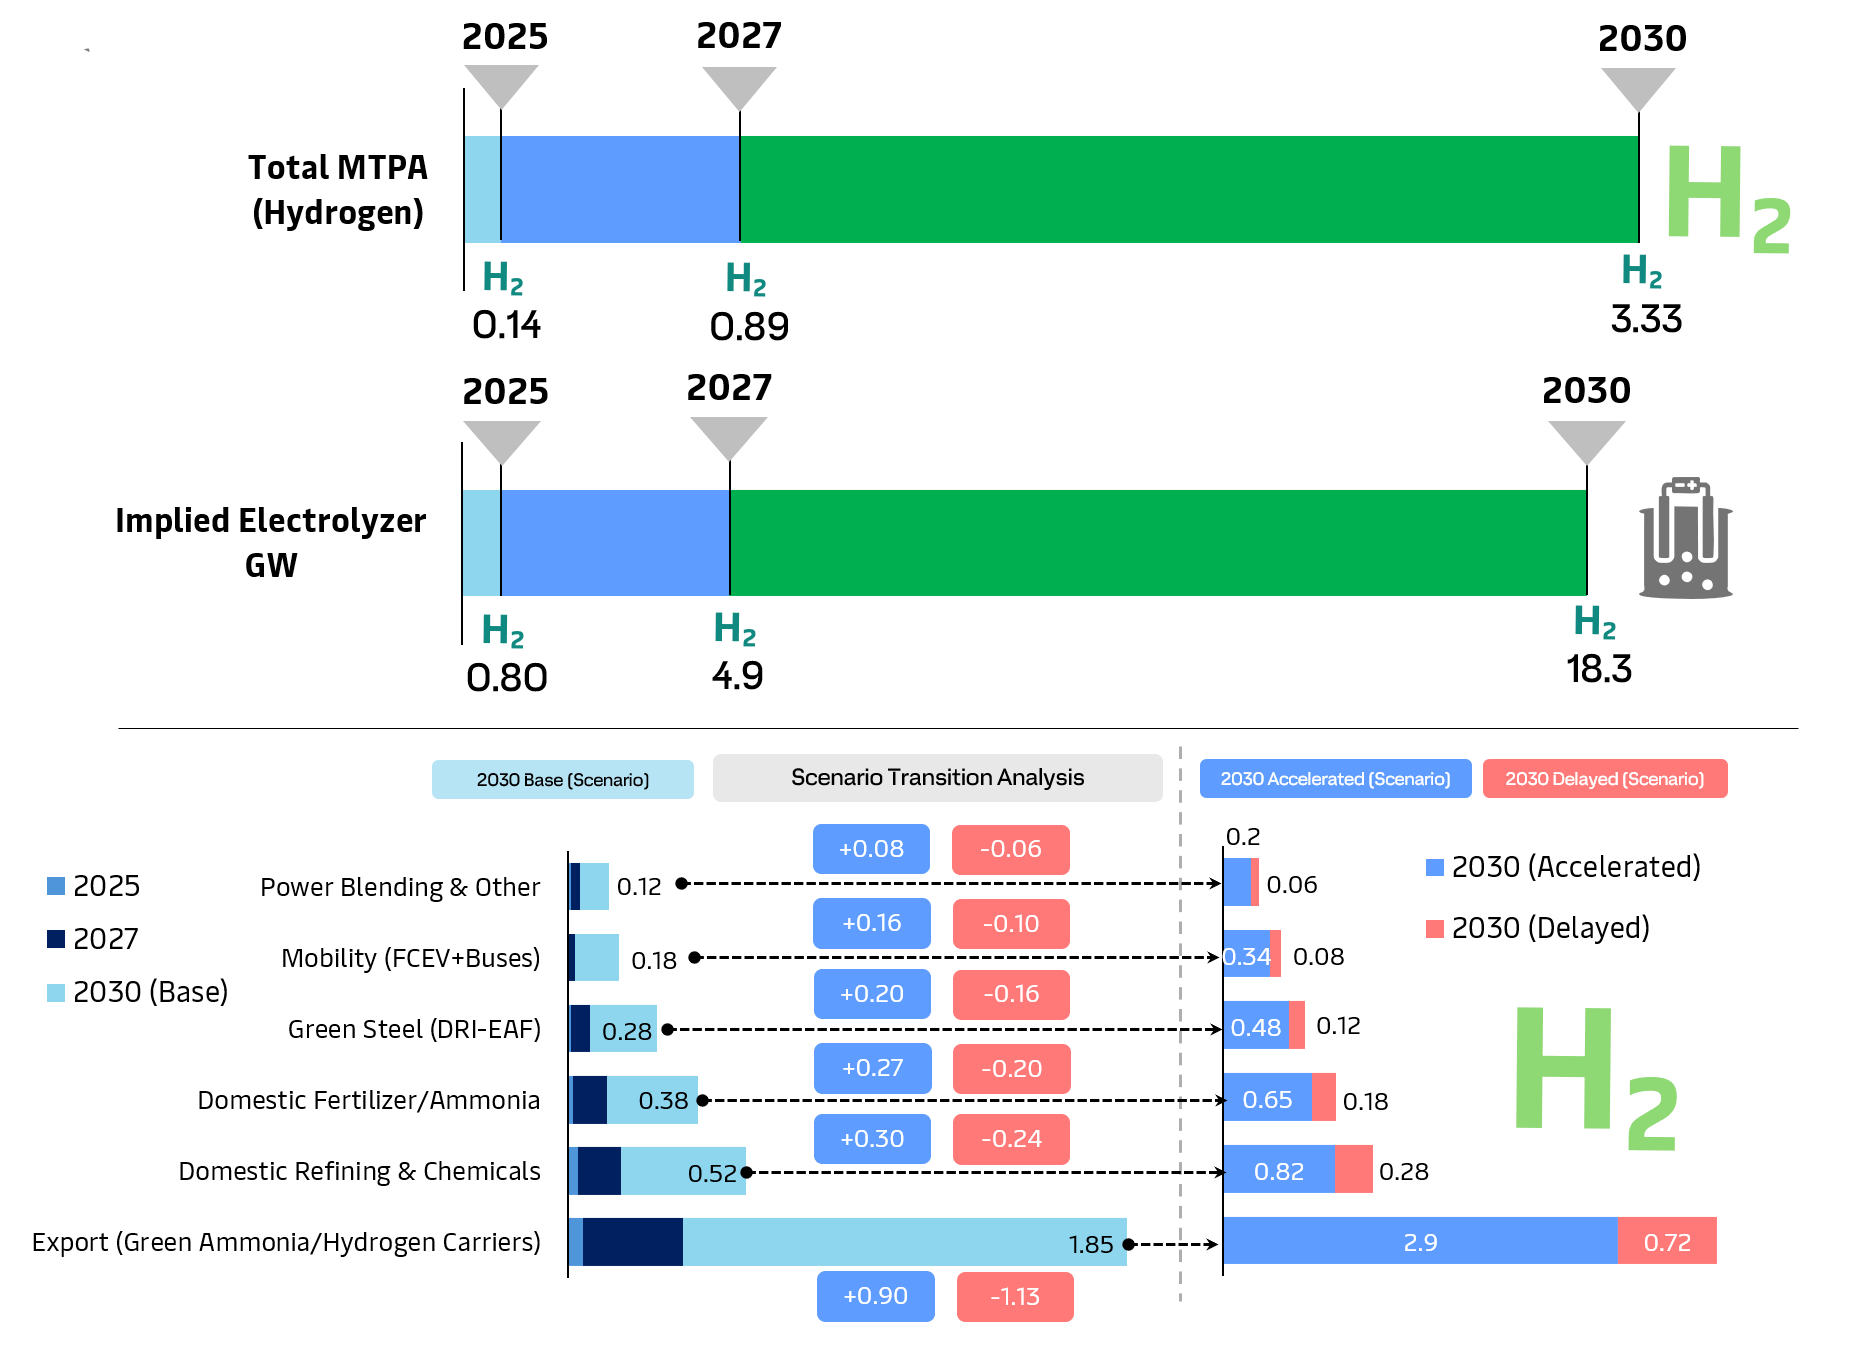
Source: eninrac analysis & scenario analysis modelling, PIB, Einfews, NGHM and SIGHT Awards
India Green Hydrogen Sector: USD 31.5 Billion Cumulative Investment Roadmap 2025‑2030
Overall Investment Architecture
India's green hydrogen sector is entering a sustained, multi‑year capital deployment cycle of US$ 31.5 billion between 2025 and 2030 under the base case structured across a 70:30 debt‑to‑equity ratio (US$ 22.1 billion debt to USD 9.5 billion equity), reflecting the project‑finance‑heavy nature of large‑scale electrolyzer, dedicated renewable energy, and export‑terminal infrastructure. Peak annual investment of US$ 7.1 billion is projected in the 2029‑2030 scale‑up phase, with an additional US$ 3.2 billion earmarked exclusively for domestic electrolyzer manufacturing capacity build‑out under PLI‑backed gigafactory programmes signalling that India's green hydrogen capital cycle is not merely a generation‑side story but a full industrial ecosystem investment.
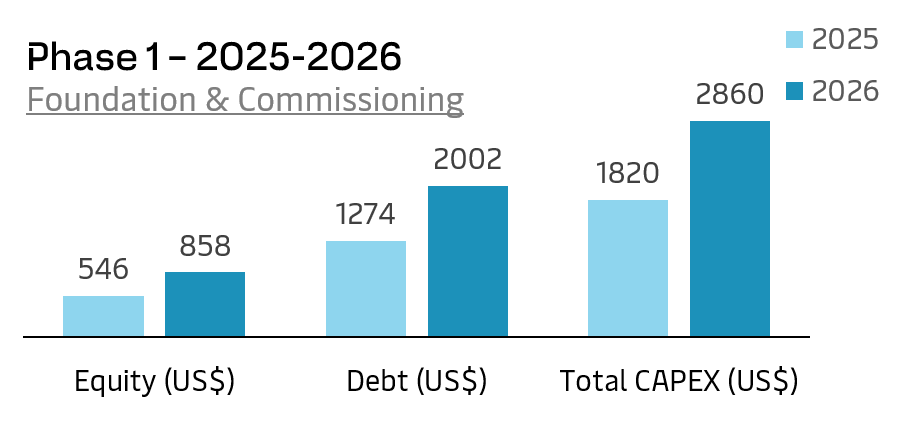
Phase 1 – Foundation & Pilot Commissioning (2025‑2026)
Cumulative Capex: USD 4.68 Billion · Electrolyser Installed: 2.1 GW · Production: 0.38 MTPA
The 2025‑2026 period represents India's green hydrogen foundation phase characterised by first‑mover project commissioning, SIGHT PLI disbursement initiation, and SECI tender project financial closures. Annual capex of USD 1.82 billion in 2025 rising to USD 2.86 billion in 2026 reflects early‑stage electrolyzer procurement, dedicated solar and wind RE tie‑ups, and site development across priority hubs in Gujarat, Rajasthan, and Andhra Pradesh. Equity deployment remains conservative at USD 546 million and USD 858 million respectively consistent with DFI‑blended structures where multilateral financing de‑risks early‑mover projects. Production of 0.14 MTPA in 2025 scaling to 0.38 MTPA by end‑2026 confirms that Phase I is a proof‑of‑concept and infrastructure‑laying cycle, not yet a volume market.
Eninrac Analyst View: Phase I capex is dominated by electrolyzer import costs and RE land acquisition – the two variables that will compress sharply from 2027 onward as domestic manufacturing scales and state land‑allotment frameworks mature.
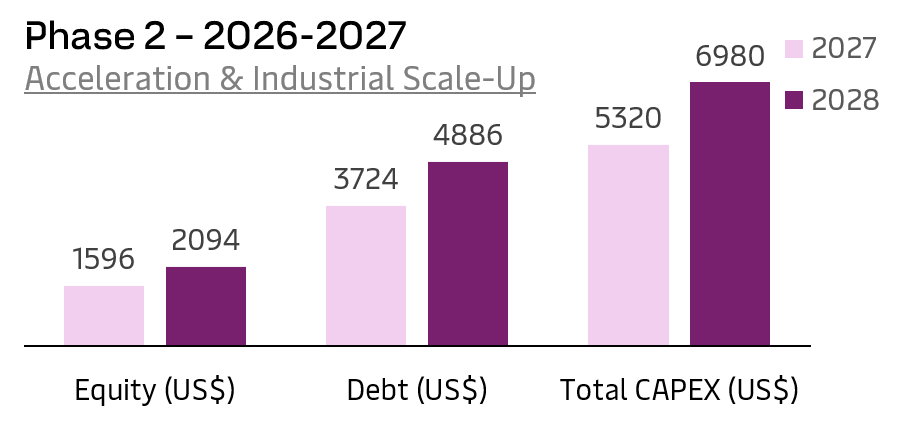
Phase 2 – Acceleration & Industrial Scale‑Up (2027‑2028)
Cumulative Capex: USD 16.98 Billion · Electrolyser Installed: 6.9 GW · Production: 1.25 MTPA
The 2027‑2028 window marks India's first inflection point in green hydrogen investment with annual capex surging to USD 5.32 billion in 2027 and USD 6.98 billion in 2028, representing the single largest two‑year capital mobilisation in the sector's history. This phase is driven by the simultaneous commissioning of export‑oriented green ammonia plants in Gujarat and Andhra Pradesh, domestic refinery hydrogen substitution mandates taking effect, and PLI‑backed electrolyzer gigafactories achieving initial production runs. Electrolyzer installed base crosses 6.9 GW cumulatively, while production reaches 1.25 MTPA crossing the threshold at which India begins to register as a meaningful global green hydrogen supplier. Debt deployment accelerates sharply – USD 3.72 billion in 2027 alone – reflecting project‑finance structures maturing as lenders gain comfort with offtake security and technology risk profiles.
Eninrac Analyst View: 2027 is the critical execution year in which projects that achieve financial closure in 2025‑2026 will get commissioned here, validating India's LCOH trajectory and unlocking the next wave of FDI commitments. Delays in this phase carry a compounding cost that risks pushing grid parity timelines beyond 2033.
Source: Eninrac Consulting – Model for Investment Sizing & Capex Phasing Framework*
*Note – Base Case assumes 70:30 D:E ratio, DFI‑blended debt at 8.5 % INR / 6.2 % US$, SIGHT PLI active through 2027, and SECI Phase I & II tender projects achieving financial close by Q2 2026. All figures in nominal USD millions.
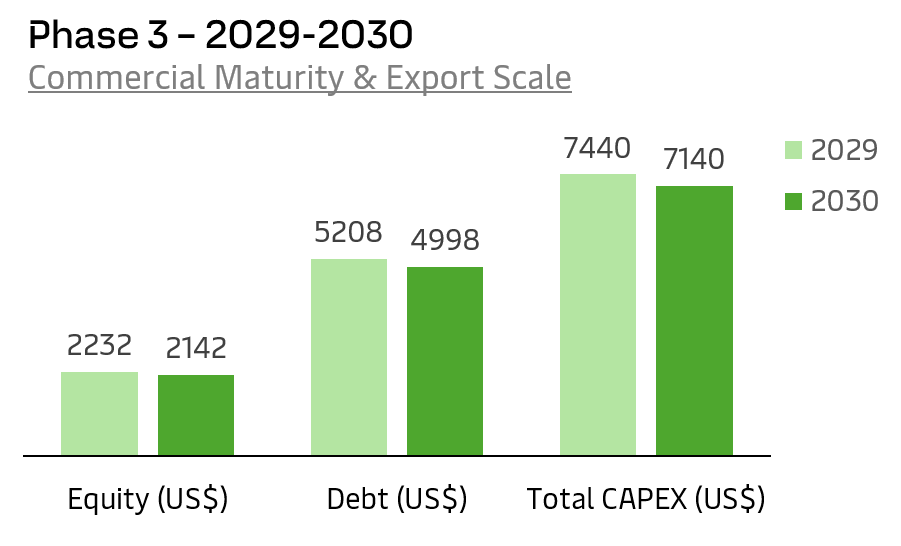
Phase 3 – Commercial Maturity & Export Scale (2029‑2030)
Cumulative Capex: USD 31.56 Billion · Electrolyser Installed: 18.3 GW · Production: 3.33 MTPA
The 2029‑2030 phase represents India's green hydrogen commercial maturity window with annual capex peaking at US$ 7.44 billion in 2029 before moderating to US$ 7.14 billion in 2030 as the investment cycle begins to plateau and operational cash flows from commissioned assets start recycling into the capital stack. Total electrolyzer capacity reaches the NGHM target of 18.3 GW, production achieves the base case of 3.33 MTPA, and the cumulative investment pool closes at US$ 31.56 billion. The 2030 equity deployment of USD 2.14 billion against debt of US$ 4.99 billion confirms sustained 70:30 leverage discipline and the export green ammonia segment's P50 levered IRR of 19.2 % (P10: 14.2 % · P90: 25.8 %) validates the risk‑return proposition for institutional and infrastructure investors entering at this stage.
Eninrac Analyst View: Phase III capex moderation is a healthy signal as it reflects a market transitioning from construction‑led growth to operations‑led revenue generation. The US$ 7.1 billion peak annual investment in 2029‑2030 will attract infrastructure funds, InvIT structures, and export‑credit‑agency‑backed financing as asset classes mature and revenue visibility improves.
Source: Eninrac Consulting – Model for Investment Sizing & Capex Phasing Framework*
*Note – Base Case assumes 70:30 D:E ratio, DFI‑blended debt at 8.5 % INR / 6.2 % US$, SIGHT PLI active through 2027, and SECI Phase I & II tender projects achieving financial close by Q2 2026. All figures in nominal USD millions.
LCOH Benchmarks by Geography & Pathway
India Green Hydrogen Cost Trajectory 2025–2030: State-Wise LCOH Decline, Grey Hydrogen Parity & Export Pathway Economics
India's green hydrogen production costs are on a decisive downward trajectory which is falling from US$ 4.42‑4.88 /kg in 2025 to US$ 2.68‑2.95 /kg by 2030 across key state hubs. Rajasthan emerging as India's most competitive green hydrogen production geography, achieving the lowest LCOH of US$ 2.68 /kg by 2030 on the back of sub‑US$ 0.019/kWh solar tariffs and alkaline electrolyzer efficiency gains. Andhra Pradesh and Gujarat follow closely, leveraging seawater desalination and hybrid solar‑wind assets respectively, while Tamil Nadu's offshore‑wind‑powered PEM pathway signals a premium‑cost but technology‑diverse production corridor.
Grey hydrogen parity at US$ 1.90 /kg remains the critical commercial threshold, with leading states projected to achieve parity between 2031 and 2033, and green hydrogen for steel via DRI captive route facing a longer runway beyond 2035 given coke's structural cost advantage. For export markets, green ammonia landed in the EU at US$ 4.20 /kg by 2030 approaches NH₃ parity of US$ 3.80 /kg making 2032‑33 the pivotal window for Indian exporters to lock in long‑term supply agreements with European offtakers.
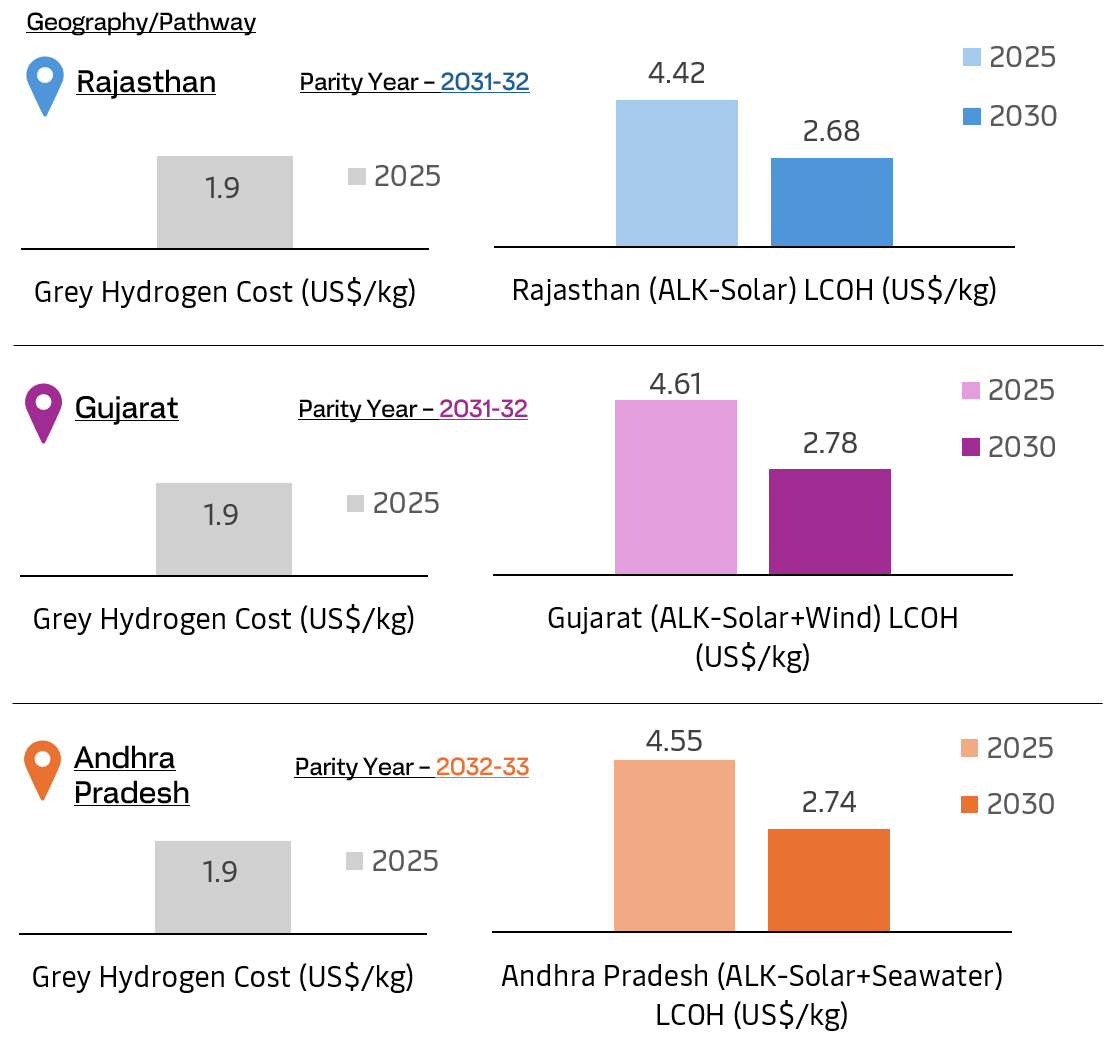
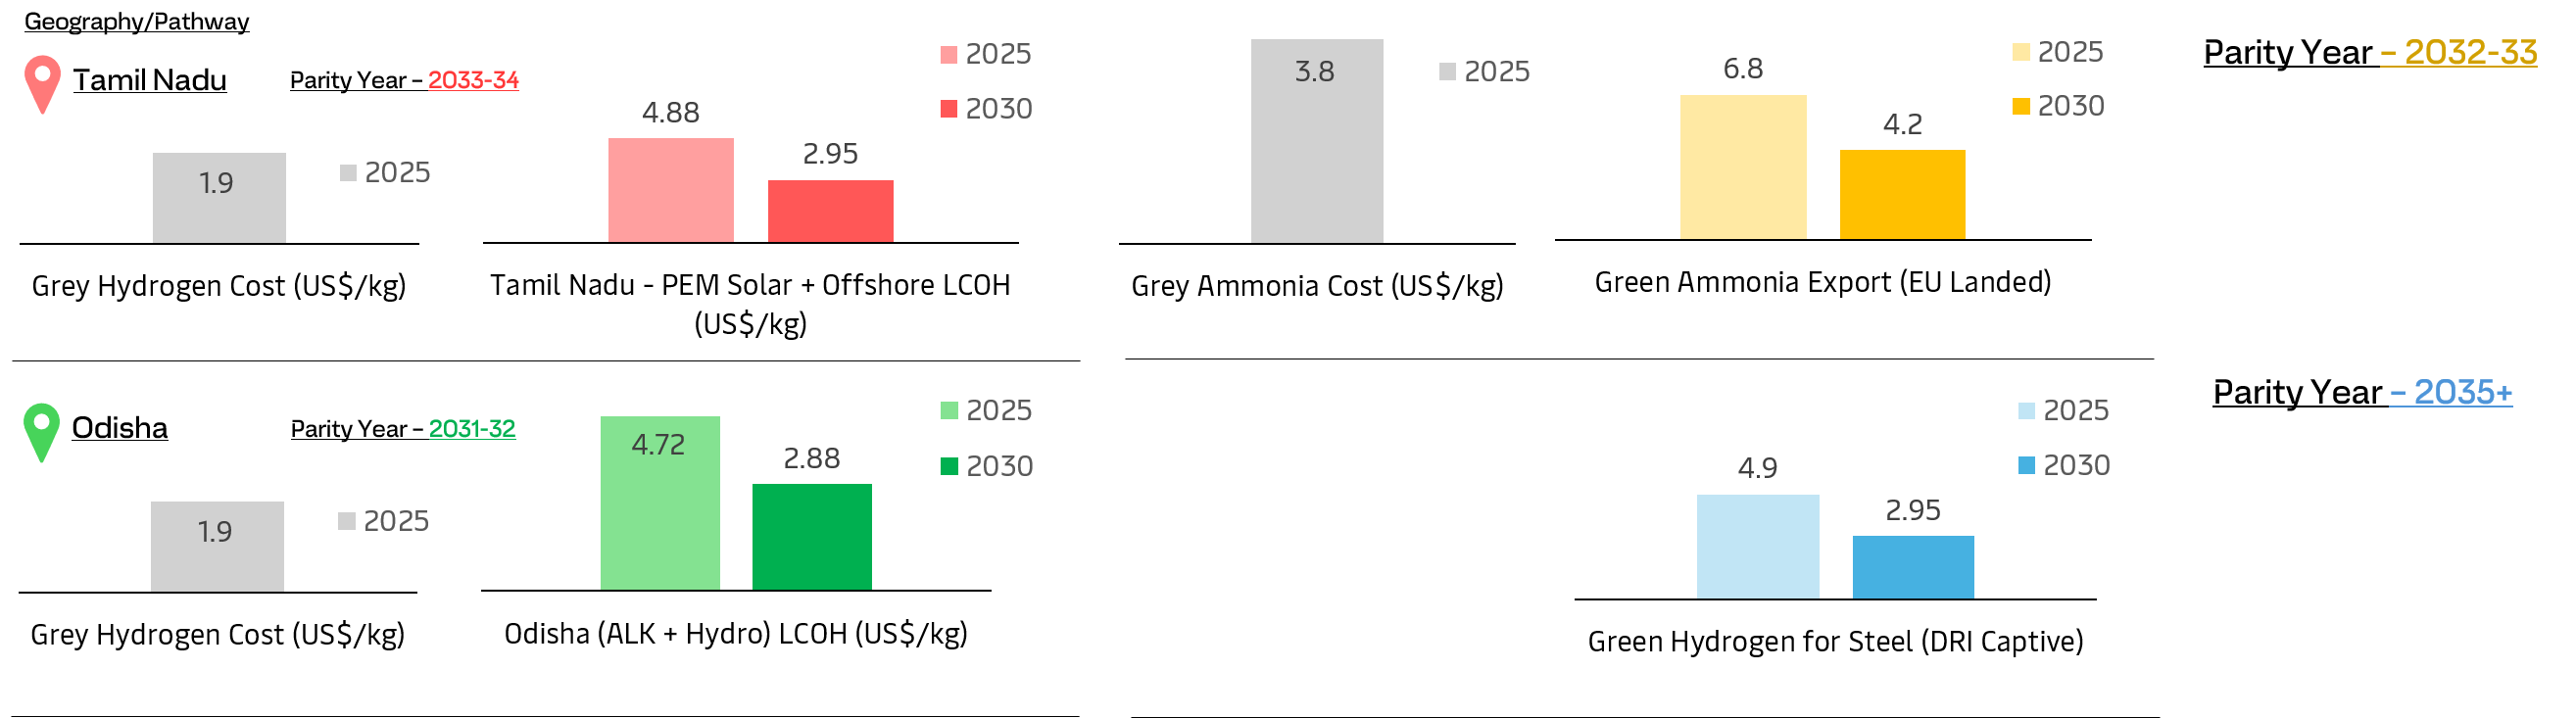
Source: Eninrac Consulting - Model for Green Hydrogen Cost Pathways in India
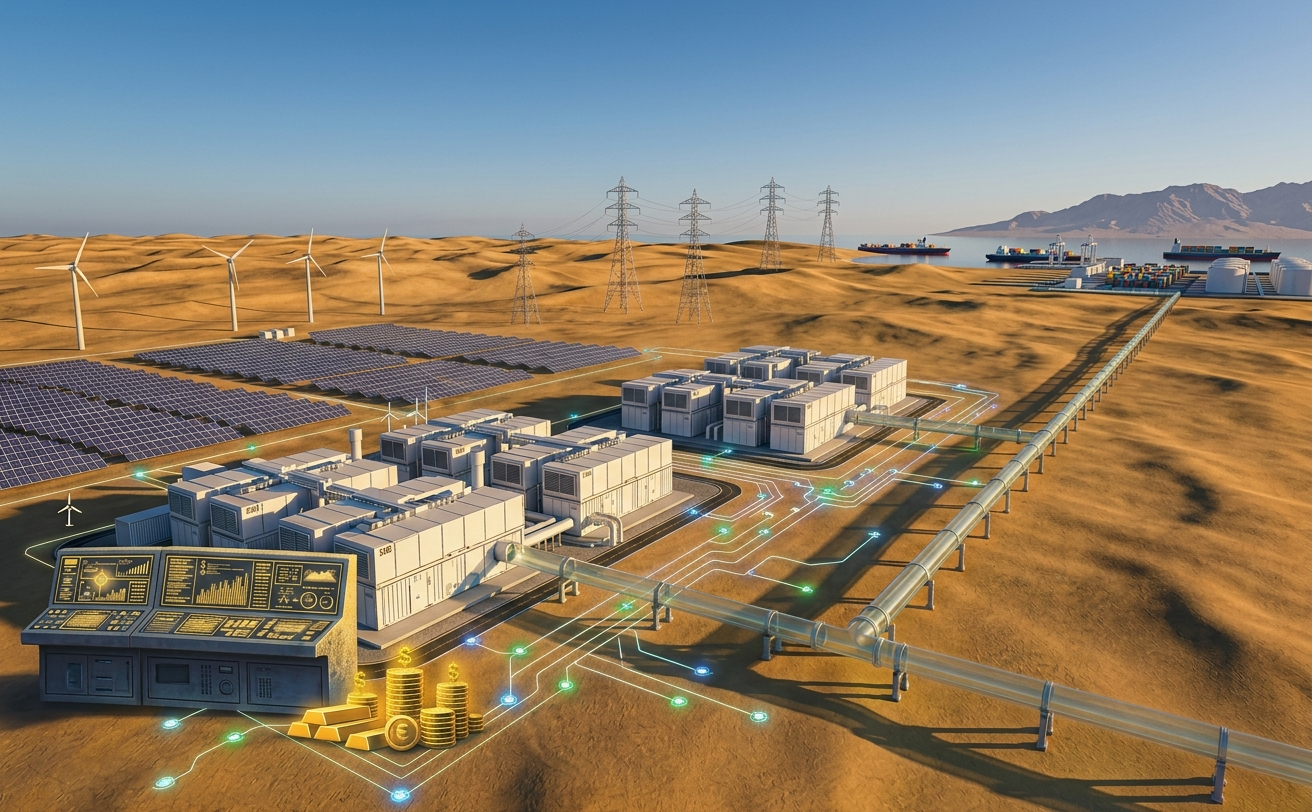
Full Value‑Chain: Opportunity at Each Node
India Green Hydrogen Value Chain Investment Map: RE Generation to End-Use Conversion — Cost Shares, IRR Corridors & Strategic Entry Points
India's green hydrogen value chain presents differentiated investment opportunities across seven distinct nodes with renewable energy generation commanding 44 % of LCOH and representing the single largest capex pool of US$ 13.8 billion, making RE developer and IPP positioning the highest‑leverage entry point in the entire ecosystem. Electrolyzer manufacturing at 35 % of LCOH and requiring US$ 3.2 billion in domestic manufacturing capex is the most strategically contested node, with India needing to scale from under 1 GW domestic capacity today to 18.3 GW by 2030, driving Adani and Reliance gigafactory investments and creating urgent JV opportunities for international OEMs seeking PLI‑backed localisation.
Mid‑stream infrastructure compression & storage (6 % of LCOH), ammonia synthesis (7 % export margin), and port & pipeline tolling offer regulated, predictable returns of 11‑14 % IRR P50 under InvIT structures viable from 2027, while EPC and system integrators capture 12‑18 % margins on plant cost collectively positioning India's green hydrogen value chain as a multi‑entry, multi‑return investment landscape for every category of global and domestic capital.
Opportunity Rankings
- Export Green Ammonia from Gujarat / AP Hub (20‑yr SPA, Japan/EU buyer) – Strategic Signal: Priority FDI – IRR P50: 19.2 %
- Electrolyzer Manufacturing – PLI‑Backed Gigafactory – Strategic Signal: Make‑in‑India mandate – IRR P50: 14.8 %
- Domestic Refinery H₂ – IOC / HPCL Offtake (PPAC mandate) – Strategic Signal: Mandate Backed – IRR P50: 17.4 %
- Green Fertilizer / Ammonia – NFL/FACT Offtake (₹ 50/kg PLI) – Strategic Signal: PLI + PSU Offtake – IRR P50: 16.6 %
- Port & Pipeline Infrastructure Tolling (MoPSW program) – Strategic Signal: InvIT Eligible – IRR P50: 14.4 %
- Green Steel DRI – JSW/Tata Captive (CBAM premium) – Strategic Signal: CBAM Value Add – IRR P50: 15.8 %
- Green Methanol – Maritime / Chemical (IMO 2030) – Strategic Signal: Emerging Carrier – IRR P50: 15.6 %
- H₂ Mobility – Bus Depot + FCEV Corridor (Delhi‑Mumbai) – Strategic Signal: White Space – IRR P50: 12.2 %
India Green Hydrogen Market – Risk Dashboard Severity x Likelihood Matrix
| Risk Factor | Severity | Likelihood | Mitigation Pathway |
|---|---|---|---|
| Offtake market immaturity – no standard H₂ PPA | HIGH | HIGH | SIGHT PLI + industrial mandate offtake; bilateral SPA via SECI tender |
| EU RFNBO certification rejection for Indian H₂ | HIGH | MED | India‑EU MoU on GO equivalence; CertifHy alignment by 2026 |
| Electrolyser cost gap – China supply dependency | MED | MED | PLI‑backed domestic mfg; JV with Nel/ThyssenKrupp/Cummins |
| Water stress – freshwater scarcity in H₂ hubs | MED | MED | Seawater desalination CapEx; CCAP compliance; coastal site selection |
| Grid connectivity / RE curtailment | MED | LOW | Dedicated captive RE; must‑run status; CEA green H₂ grid code |
| SIGHT PLI discontinuation post‑2027 | MED | LOW | Long‑term SPA locks in economics; LCOH falling toward market parity |
KEY SIGNPOSTS – India Green Hydrogen Outlook 2026-2035
- Policy catalyst: SIGHT 2.0 as the commercial trigger – Revised SIGHT 2.0 incentives targeting 5 MMT annual production by 2030 and are poised to de‑risk the first wave of bankable projects across fertilizer, refining & steel.
- Cost frontier: the sub‑US$ 2.50/kg imperative by FY29‑30 – Electrolyzer localisation, RE tariff compression below ₹ 2/kWh & stack efficiency gains converge to make sub‑$2.50/kg green hydrogen commercially viable at scale.
- Green Hydrogen Hubs: anchoring industrial demand clusters – Kandla, Paradip, Vizag & Tuticorin hubs will serve as integrated production‑offtake ecosystems, attracting port‑linked export infrastructure and captive industrial users.
- CBAM readiness: turning EU export compliance into a revenue lever – EU Carbon Border Adjustment Mechanism obligations on steel & fertilizer exports create a structural premium for green hydrogen‑derived products unlocking export FIDs.
- Electrolyzer localisation: building a domestic manufacturing moat – EU Carbon Border Adjustment Mechanism obligations on steel & fertilizer exports create a structural premium for green hydrogen‑derived products unlocking export FIDs.
- Green ammonia: the primary near‑term demand anchor – Fertiliser sector decarbonisation mandates and green shipping fuel demand position green ammonia as India’s highest‑volume, fastest‑bankable hydrogen derivative by 2030.