Decoupling The Green Future: India’s Renewable Sector And The Trump Tariff Shock
Analyzing tariffs exposed supply chain vulnerabilities, prompting India to boost local manufacturing and diversify renewable energy sourcing.
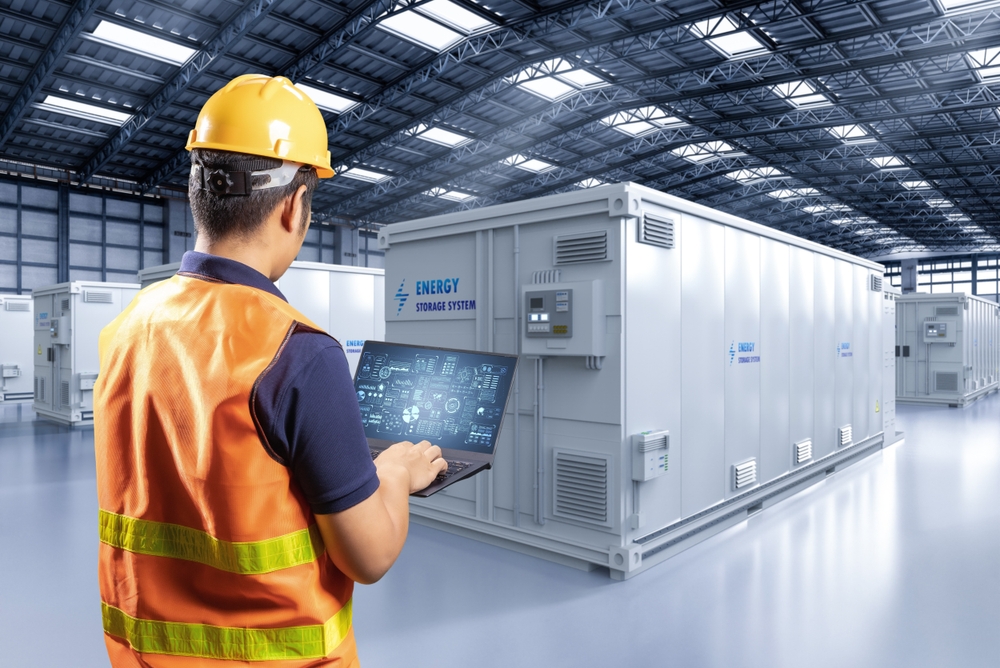
Overview of India’s Renewable Energy Sector
India stands as the third-largest renewable energy market in the world, underscoring its strategic commitment to clean energy transition and climate resilience. As of June 2025, the country has achieved a cumulative installed renewable energy capacity of approximately 185 GW, which includes small hydroelectric power.
This rapid expansion is driven by a robust policy ecosystem, declining costs of renewable technologies, and strong participation from private and foreign investors. However, the sector remains significantly dependent on imports for several critical components, particularly in the solar and battery storage segments.

Key Dependencies on Imports and Impact of U.S. Trade Policies
India’s over-reliance on imports especially from China, poses a potential risk considering evolving global trade dynamics. While the U.S. share in India’s renewable component imports remains relatively small, any shift in U.S. tariff or export control policies could indirectly impact India through disruptions in global supply chains or increased competition for critical materials. To mitigate these risks, India has been promoting domestic manufacturing through policy initiatives like the Production Linked Incentive (PLI) scheme for solar PV modules, advanced battery storage, and wind equipment. Strengthening indigenous capabilities across the renewable value chain is crucial for achieving energy security and meeting the 2030 targets sustainably.

Impact of U.S. Tariffs on India’s Renewable Energy Sector
The U.S. tariffs on steel, aluminum, and solar components had a ripple effect on India’s renewable energy transition. Imported solar module prices surged by 10–15%, while steel-intensive project infrastructure became costlier, driving up overall project costs. These disruptions delayed several utility-scale solar projects. In response, India pushed aggressively for supply chain diversification and boosted domestic manufacturing under Production-Linked Incentive (PLI) schemes to reduce import dependence. While reciprocal tariff measures were considered, the government prioritized long-term self-reliance and energy security.
However, global policy instability around tariffs also created investor uncertainty, slowing down foreign direct investment (FDI) inflows into renewable energy projects. This highlights the importance of a stable policy environment and resilient supply chains for India to achieve its 2030 target of 500 GW non-fossil capacity.

Import Dependency Snapshot (Pre-Tariffs)
Before the imposition of tariffs, India’s renewable energy sector was heavily dependent on imports, particularly from China. In 2017, nearly 88% of solar modules and around 60% of inverters were sourced from China, while the U.S. accounted for only a minor share (2% and 5% respectively). Similarly, about 55% of steel and 45% of aluminum structures used in solar projects were imported, with China again being the dominant supplier. This high reliance on external markets underscored the sector’s vulnerability to global trade policies and tariff shocks.

Key Observations:
- Solar modules (cells + modules): China’s share was ~73% in Q1’24, 67.8% in Q2’24, and rose to 86.5% in Q4’24. The U.S. share was ~0.3% in 2024.
- Inverters (grid-tied): Shipment data (Oct’23–Sep’24) show near-exclusive sourcing from China for grid inverters (shipment-count proxy), implying a ~98–100% China share; U.S. negligible.
- Steel for structures (proxy): FY2023–24 finished steel imports into India: China 2.687 Mt out of 8.320 Mt total (≈32.3%); U.S. 0.020 Mt (≈0.24%). Used as a proxy for mounting steel.
- Aluminum structures (proxy – HS 7610): Oct’23–Sep’24 shipment shares into India show China ≈59% (Japan ~10%, Germany ~9%); U.S. not among the top three (low single digits). Also note the anti-dumping duty imposed in Sep 2024 on anodized solar frames from China, which reinforces China’s dominance in this category but may alter 2025 flows.
Potential Impact of U.S. Tariffs on India’s Solar Sector
Why India is exposed: India imported ~80% of its modules from China in 2024 (share fluctuated by quarter), and SE Asia is the next best “swing” supply. Tightening U.S. access to China + SE Asia redirects global flows, bidding up world prices India pays.

Scenario Wise Impact of US Tariffs on India
Assumptions
- India baseline landed module price (2024/early-2025 planning): $0.20/W (your starting point).
- Modules = ~20–40% of utility-scale capex; we use 40% (upper bound) to show “worst-case” capex sensitivity.
- 100 MW_dc reference project; BOS unchanged across scenarios.
1. Price Scenarios

Note: Ranges reflect supplier behavior and re-routing frictions; they’re consistent with U.S. trade actions noted above and historic premiums vs. global spot
2. Impact on Indian Project Costs (100 MW_dc example; modules = 40% of capex)

How to read: Project capex ↑ ≈ (% rise in module price) × (module share of capex). Module share varies by project; 20–40% is common—so the capex effect scales down if you assume 25–30%.
3. Possible LCOE Effects (directional)
If capex is the main LCOE driver (typical for PV), then +13% capex could translate to roughly +8–12% LCOE, and +25% capex to +15–20% LCOE, depending on WACC & CUF. (Empirical work shows LCOE is notably sensitive to capex; module price shocks have proportionated but moderated LCOE effects.)