India’s Wind Energy Landscape 2026
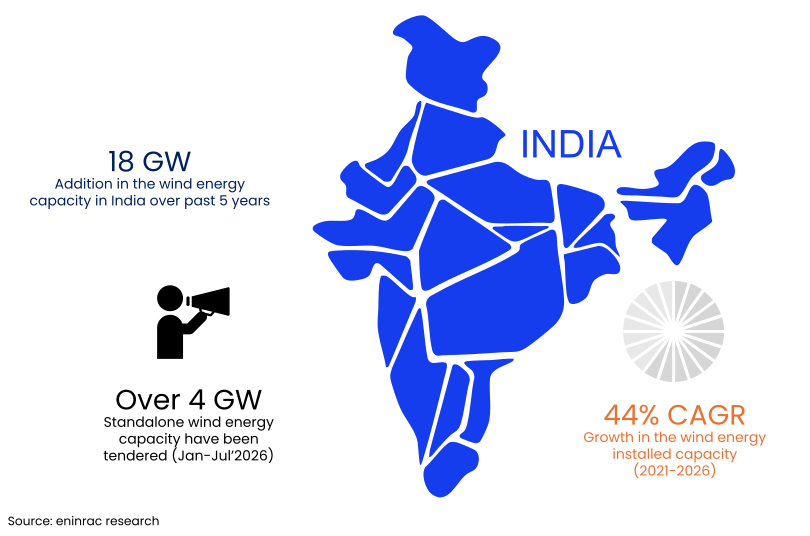
As of June 2026, India’s wind energy installed capacity stood at 57.4 GW. Over the past five years nearly 18 GW of addition has been witnessed in the wind energy installation, with maximum capacity addition (over 6 GW) observed in year 2025-26.
Executive Summary & Analyst Perspective
Capacity & Generation
- India's installed wind capacity reached 57.4 GW as of June 2026, up nearly 18 GW over five years, with a record ~6.05 GW added in 2025-26 alone – the steepest annual jump in the dataset
- Generation climbed to 106 BU in 2025-26, a ~28% jump after two flat years (83 BU in both 2023-24 and 2024-25), signaling capacity utilization finally catching up with capacity additions
- Gujarat and Karnataka anchor the market, together delivering over half of FY26 generation (33.7 BU and 18.8 BU respectively) and tied at 5.8 GW each of capacity under implementation
- Karnataka's growth is steady and diversified across a broad IPP base, while Gujarat, Rajasthan and Andhra Pradesh show lumpier, tender-driven additions concentrated in specific years
- Generation is strongly monsoon-seasonal: output roughly triples between the June-September peak (led by July) and the October-November trough, reflecting India's pressure-gradient wind system
Pipeline, Manufacturing & Policy
- Over 4 GW of wind capacity was tendered between January and July 2026 across GUVNL, SJVNL, SECI and CESC auctions, with clearing tariffs compressing to ₹3.43-3.85/kWh
- Nearly 29.4 GW of capacity is under implementation nationally, though concentration remains high; Tamil Nadu's pipeline (0.87 GW) looks thin relative to its legacy installed base
- Domestic turbine manufacturing capacity has grown from 10 GW (2014) to 24 GW (2026) under Aatmanirbhar Bharat, with nearly 30 active OEMs competing across the value chain
- Offshore wind is moving from policy to execution: lease rules (2023), a Viability Gap Funding scheme, and ~10 GW of planned transmission off Gujarat and Tamil Nadu lay the groundwork for India's first offshore projects
- Adani, ReNew, Sembcorp and other pan-India IPPs increasingly hold diversified, multi-state portfolios, signaling consolidating investor confidence in the sector
Analyst Perspective
- Maturity is diverging, not converging. Karnataka's steady build-out and a domestic OEM base now numbering nearly 30 players point to a sector professionalising quickly; yet growth stays lumpy elsewhere, with a handful of mega-tenders still driving most annual additions in Gujarat, Rajasthan and Andhra Pradesh.
- Generation is catching up to capacity. The jump to 106 BU in 2025-26 after two flat years suggests earlier additions are finally converting into delivered energy – a trend worth watching, since sustaining it depends on transmission and grid-evacuation capacity keeping pace with new commissioning.
- Offshore is the next frontier, not yet a contributor. Lease rules, Viability Gap Funding, and ~10 GW of planned transmission off Gujarat and Tamil Nadu put the policy groundwork largely in place; the near-term growth story, however, stays firmly onshore.
- Watch Tamil Nadu, and the diversification underway. Tamil Nadu's thin pipeline despite a large base may signal site saturation, while the growing "Others" share of under-implementation capacity shows developers scouting beyond the core five states.
Installed capacity, June 2026
Installed capacity growth, 2021-2026
Capacity under implementation, Mar 2026
Wind generation, 2025-26 (+28% YoY)
Growth In The Annual Installed & Generation Capacity
Annual Installed Capacity of Wind Energy in India
Historic Trends (2021-22 to 2025-26)
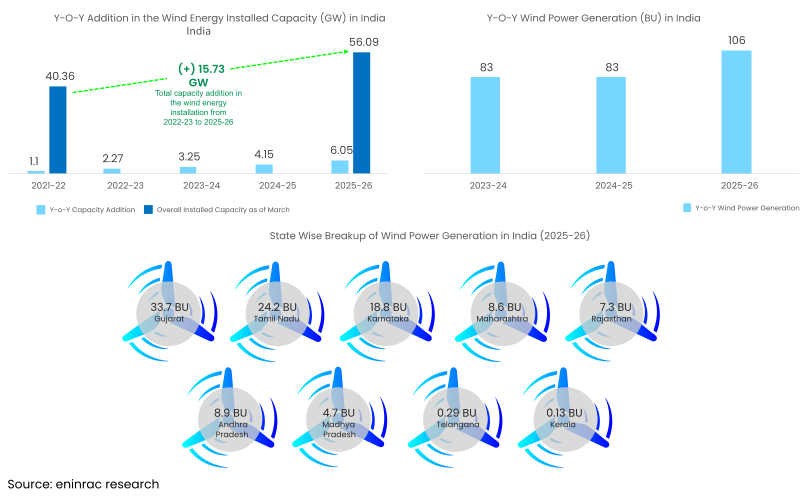
India's wind energy sector has demonstrated a clear trajectory of accelerating growth over the 2021-26 period, with overall installed capacity rising from 40.36 GW to 56.09 GW, an addition of 15.73 GW driven by steadily increasing year-on-year installations that climbed from a modest 1.1 GW in 2021-22 to a record 6.05 GW in 2025-26. This sharp uptick in the final year — the steepest annual jump in the dataset — points to strengthening investor confidence, policy support, and a maturing project pipeline. On the generation front, however, output remained flat at 83 BU for both 2023-24 and 2024-25 despite ongoing capacity additions, suggesting a lag between commissioning and full operational ramp-up, possibly compounded by weaker wind resource years or grid curtailment issues; this makes the subsequent surge to 106 BU in 2025-26 (a ~28% increase) particularly notable, as it finally reflects the record capacity additions translating into tangible generation gains and signals improved capacity utilization and asset performance. Taken together, the data suggests India's wind sector is transitioning from a phase of slow, incremental growth into a period of accelerated expansion in both installed base and actual energy delivery, though sustaining this momentum will likely depend on parallel improvements in grid integration and transmission infrastructure to prevent the kind of generation lag observed between 2023 and 2025.
State Wise Growth In The Wind Energy Installed Capacity
Y-o-Y Installed Capacity Addition in Wind Energy across Indian States
Historic Trends (2021-22 to 2025-26)
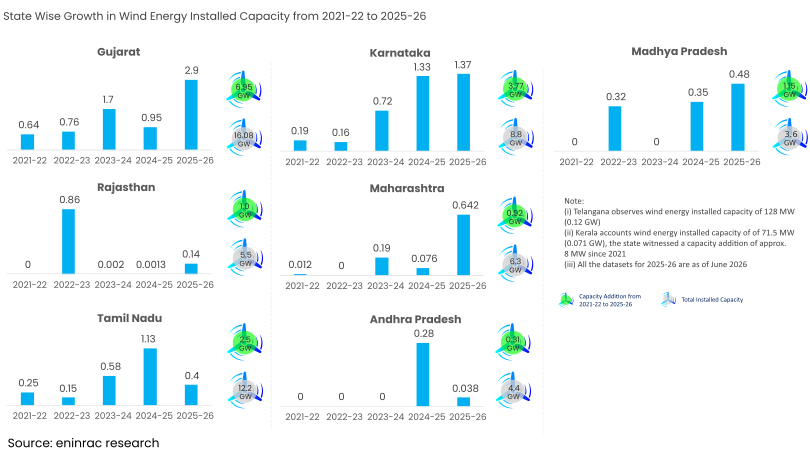
India's state-wise wind capacity data reveals sharply divergent growth patterns, with Karnataka (16.08 GW total) and Gujarat (6.95 GW total) emerging as the two dominant markets, followed by Tamil Nadu (12.2 GW), Maharashtra (5.5 GW), and much smaller contributions from Rajasthan, Madhya Pradesh, and Andhra Pradesh. Gujarat displays a distinctly non-linear, almost sinusoidal trajectory — rising from 0.64 GW (2021-22) to 1.7 GW (2023-24), then dipping to 0.95 GW (2024-25), before surging to 2.9 GW (2025-26). This oscillation likely reflects the "lumpy" nature of large wind (and hybrid wind-solar) project execution in the state, where mega-projects tied to specific commissioning milestones — such as those in the Kutch region or large IPP-driven auctions — get concentrated in particular years, followed by a lull as the next pipeline of projects moves through land acquisition, transmission connectivity (especially given Gujarat's push for offshore and hybrid RE parks), and regulatory clearances; additionally, Gujarat's wind auctions are often bundled with solar in hybrid/RTC (round-the-clock) tenders, so capacity additions can bunch around tender award-to-commissioning cycles (typically 18-24 months) rather than flowing evenly year to year, and monsoon/land-use conflicts in coastal Kutch-Saurashtra belts can further delay projects into subsequent years, creating this peak-trough pattern.
Download the Free Wind Energy Market Report
Get the complete report with key market insights, installed capacity, state-wise trends, generation data, project pipeline, tenders, manufacturing developments and policy updates — available to download for free.